To monitor the individual pipeline runs and review if anything failed, you can go into the monitor section of the data factory:
- Open Author & Monitor for the data factory, and select the blue meter icon below the pencil in the left navigation menu.
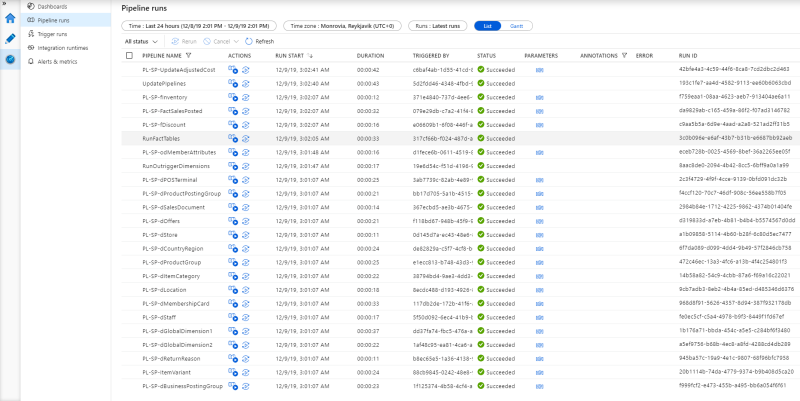
- Select Pipeline runs and the time and status of the last pipeline run is displayed.
If you want to monitor a triggered run, you can do so by selecting Trigger runs in the left navigation menu and review whether the triggered run of the pipelines ran successfully or failed.
If it failed, you can then open Pipeline runs to review which pipelines failed during the triggered run.